Locustで複数パス・複数ホストへリクエストし、それぞれ個別にGrafanaでグラフ化する
概要
負荷試験ツールのLocustを使ってWebシステムに負荷をかける。
その時、リクエストのホスト、パス毎に負荷試験結果をグラフ化したい。
Locustで上記を実現するにはどうすればよいか記録する。
バージョン
- Locust v1.6.0
- Grafana v8.0.x
- Prometheus v2.28.0
前提知識
- Locust利用経験
- Grafana利用経験
- Prometheus利用経験
LocustデフォルトのGUIについて
LocustはGUIを持つ。
https://docs.locust.io/en/stable/quickstart.html#locust-s-web-interface
デフォルトでは複数のリクエスト先に負荷をかけても合算結果のみ表示される。
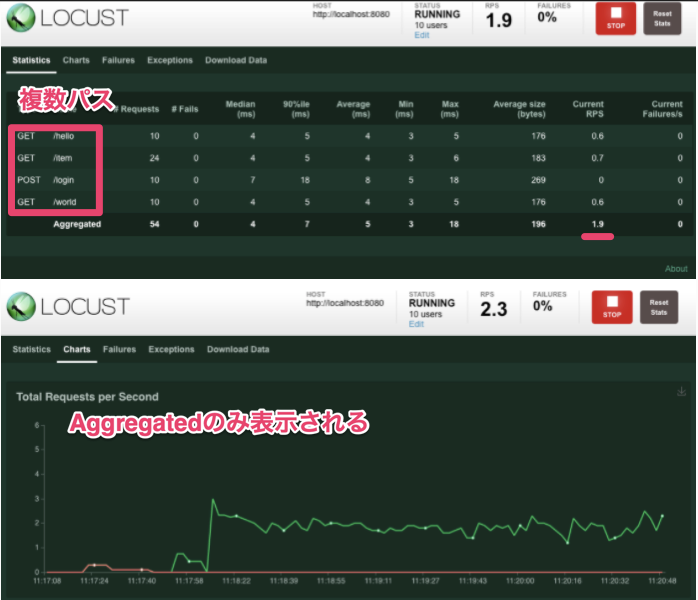
これをパスごとに結果を表示したい。
結論
Locut+Prometheus+Grafanaを利用する。
docker-compose.yaml
version: "3"

services:
  master:
    image: locustio/locust
    ports:
      - "8089:8089"
    volumes:
      - ./:/mnt/locust
    command: -f /mnt/locust/locustfile.py --master -u 10 -r 1

  worker:
    image: locustio/locust
    volumes:
      - ./:/mnt/locust
    command: -f /mnt/locust/locustfile.py --worker --master-host master

  prometheus:
    image: prom/prometheus
    container_name: prometheus
    volumes:
      - ./prometheus:/etc/prometheus
    command: "--config.file=/etc/prometheus/prometheus.yaml"
    ports:
      - 9090:9090
    restart: always

  grafana:
    image: grafana/grafana
    container_name: grafana
    volumes:
      - ./grafana/dashboards:/var/lib/grafana/dashboards/
      - ./grafana/datasource.yaml:/etc/grafana/provisioning/datasources/datasource.yaml
      - ./grafana/dashboard.yaml:/etc/grafana//provisioning/dashboards/dashboard.yaml
    ports:
      - 3000:3000
    environment:
      - GF_AUTH_ANONYMOUS_ORG_ROLE=Admin
      - GF_AUTH_ANONYMOUS_ENABLED=true
    restart: always

  locust-exporter:
    image: containersol/locust_exporter
    environment:
      - LOCUST_EXPORTER_URI=http://master:8089
    ports:
      - 9646:9646
    depends_on:
      - master
prometheus/prometheus.yaml
global:
  scrape_interval: 10s
  evaluation_interval: 10s
  external_labels:
    monitor: "codelab-monitor"

rule_files:

scrape_configs:
  - job_name: "prometheus"
    static_configs:
      - targets: ["localhost:9090"]
  - job_name: "locust"
    scrape_interval: 2s
    static_configs:
      - targets: ["locust-exporter:9646"]
grafana/datasource.yaml
# config file version
apiVersion: 1

datasources:
  # <string, required> name of the datasource. Required
  - name: Prometheus
    # <string, required> datasource type. Required
    type: prometheus
    # <string, required> access mode. proxy or direct (Server or Browser in the UI). Required
    access: proxy
    url: http://prometheus:9090
    editable: true
手順
1. Locustでリクエストをグループ化する
https://docs.locust.io/en/stable/writing-a-locustfile.html#grouping-requests
下記のように書くとstatisticsでnameごとに表示される。上記画像のようにパスごとに表示される。
# Statistics for these requests will be grouped under: /blog/?id=[id]
for i in range(10):
    self.client.get("/blog?id=%i" % i, name="/blog?id=[id]")
2. Prometheus,Locust-Exporter,Grafanaを用意する。
Prometheus,Grafanaは公式Dockerイメージがあるので利用する。(上記docker-comopse.yaml参照)
exporterは既存のものを見つけたので下記を利用する。
https://github.com/ContainerSolutions/locust_exporter
3. GrafanaのPrometheusデータソースの設定
4. Grafanaダッシュボードの用意
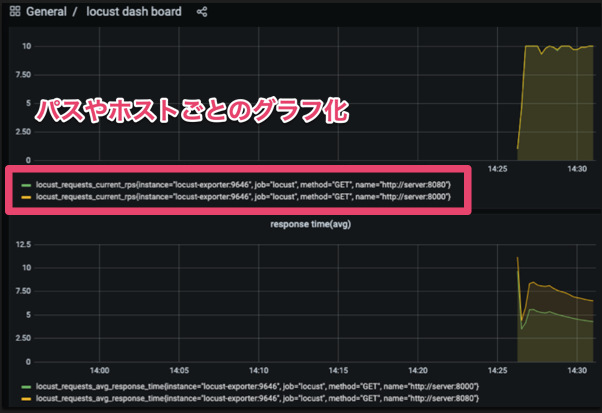
例えばRPSをパスごとに表示する場合は下記のようになる。
nameはLocustのグループで設定したものを記述する。
locust_requests_current_rps{name=\"hoge\"}
5. 負荷をかける
結果
下記のようにグループされたパス、ホストごとにグラフ化することができた。
補足
locust_exporterを利用するときはLocustの--headlessオプションが使えない。
--headlessオプションを利用するときは下記ISSUEのような対応が必要になる。
https://github.com/ContainerSolutions/locust_exporter/issues/5
まとめ
Locustでリクエストパス、ホスト毎にグラフ化することができた。 ちなみに、Gatlingはデフォルトでシナリオ毎のグラフ化機能を持つ。